Productivity Summary
Overview
The Productivity Summary module provides a consolidated view of productive, non-productive, and idle/away time across your team or for an individual employee. It helps managers evaluate time utilization, compare current performance against the previous period, and inspect daily productivity trends.
Tracker → Productivity Summary
Productivity Summary Page
Team View
Summary Cards
The top of the Productivity Summary page displays four color-coded cards comparing the current period against the previous period:
| Card | Description |
|---|---|
| Productive | Total productive time, share of tracked time (e.g. 01h 22m · 10% of tracked time), progress bar, and percentage change vs Previous |
| Non-Productive | Total non-productive time, share of tracked time (e.g. 06h 23m · 45% of tracked time), progress bar, and comparison vs Previous |
| Idle/Away | Total idle/away time, share of tracked time (e.g. 06h 23m · 45% of tracked time), progress bar, and comparison vs Previous |
| Avg/Day | Daily productive average percentage (e.g. 10% Productive Average), progress bar, and percentage change vs Previous |
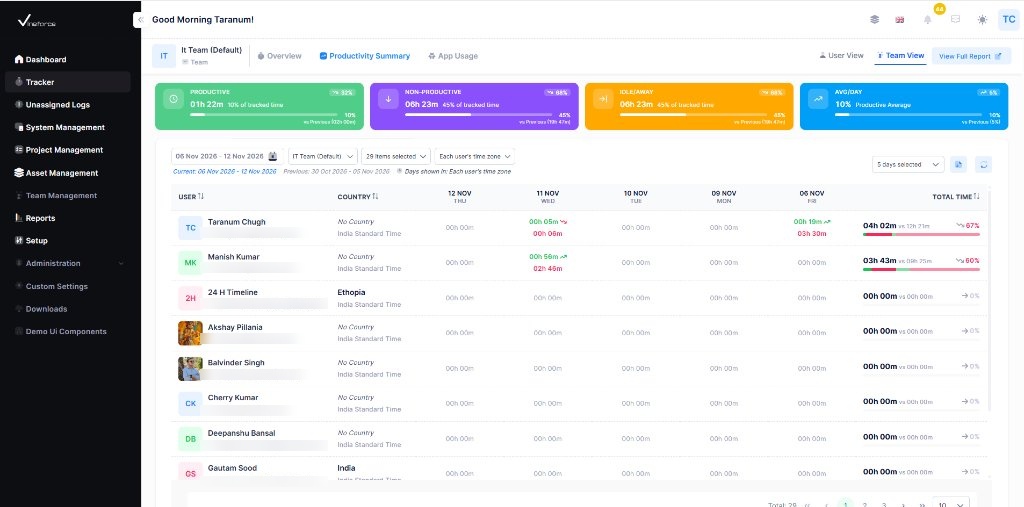
Filters for Date Range (showing Current and Previous periods), Team, Users, Time Zone (Each user's time zone), and Days Selector (5 days selected) are available above the table, along with User View / Team View, View Full Report, Export, and Refresh controls.
Productivity Summary List
Below the filters, each row displays a team member's daily and total tracked time across the selected days:
| Column | Description |
|---|---|
| User | User avatar (or initials), full name, and email address (sortable) |
| Country | User's country (or No Country) and time zone, e.g. India Standard Time (sortable) |
| Per-Date Columns | Daily columns (e.g. 12 NOV THU, 11 NOV WED) showing current time in green with trend arrow and comparison time in red, or 00h 00m |
| Total Time | Total current period time versus previous period (e.g. 04h 02m vs 12h 21m), color-coded progress bar, and percentage trend indicator (sortable) |
Pagination controls at the bottom-right show the total user count (e.g. Total: 29), page numbers, and rows per page selector.
Today's data is still processing and will be available tomorrow. The data is calculated using your team's productive and non-productive rules for Apps and URLs. You can configure these rules in Setup → Apps & URLs.
User View
Click User View in the top-right header to focus the Productivity Summary tab on a single employee.
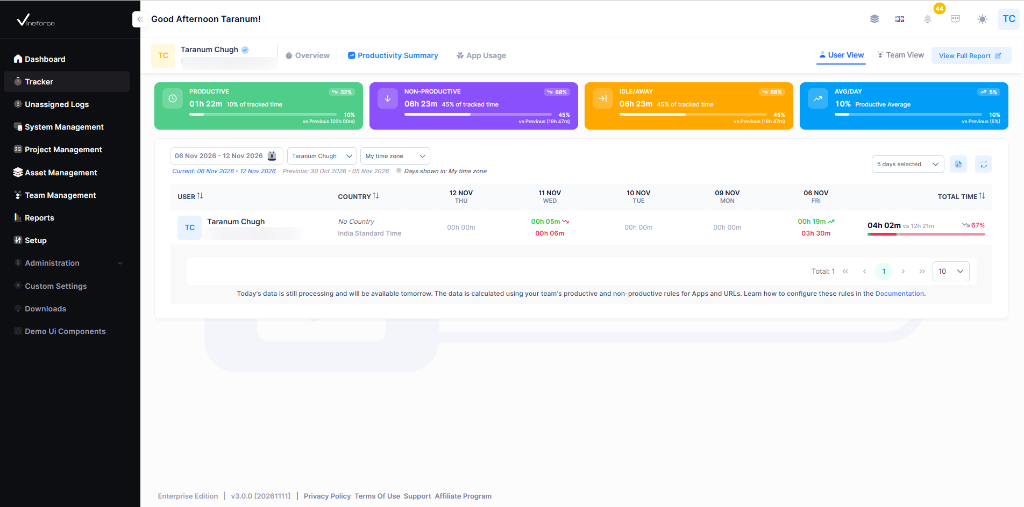
- Header — Displays the selected user's avatar and name (e.g.
Taranum Chugh). - Filters — Select the Date Range (
06 Nov 2026 - 12 Nov 2026), User (Taranum Chugh), and Time Zone (My time zone), plus Days Selector (5 days selected), Export, and Refresh controls. - Summary Cards & Table — Displays the four period-over-period summary cards and the single-user daily breakdown row.
User Productivity Detail
Clicking any user row in the Productivity Summary table opens the user's detailed productivity modal, comparing the selected date range against the previous period (e.g. Comparison: Selected (06 Nov - 12 Nov) vs Previous (30 Oct - 05 Nov)).
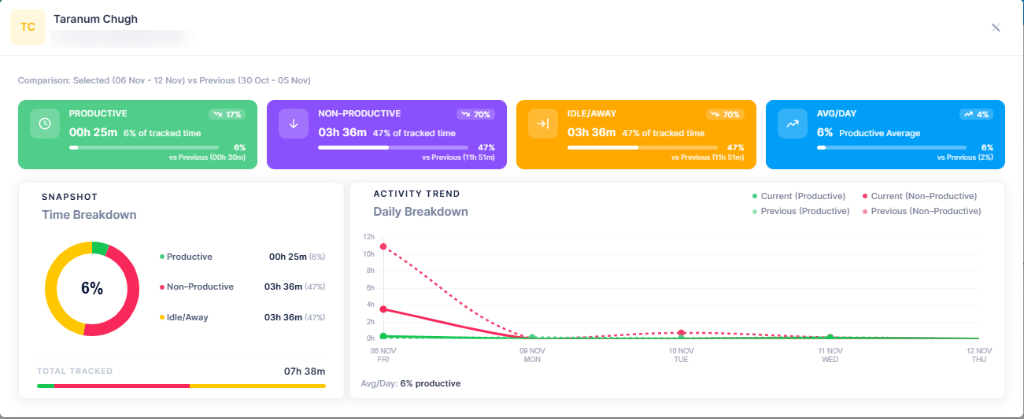
Left Panel — Snapshot (Time Breakdown)
Displays the user's overall time distribution for the selected period:
- Productive Donut Chart — Shows the overall productive percentage in the center (e.g.
6%). - Category Breakdown — Hours and percentage share for Productive, Non-Productive, and Idle/Away.
- Total Tracked — Total tracked duration with a proportional color bar at the bottom (e.g.
07h 38m).
Right Panel — Activity Trend (Daily Breakdown)
Displays a multi-series line chart comparing daily productivity across the selected days:
- Current (Productive) and Current (Non-Productive) (solid lines)
- Previous (Productive) and Previous (Non-Productive) (dashed lines)
- Avg/Day summary at the bottom-left (e.g.
6% productive).
Best Practices
- Keep Each user's time zone selected in Team View when reviewing distributed teams to accurately align daily work hours
- Click any user row to open the User Productivity Detail modal and compare Current vs. Previous daily trends
- Switch to User View when reviewing an individual employee's productivity metrics
- Ensure Apps & URLs are properly classified in Apps & URLs so productive and non-productive calculations remain accurate
- Use View Full Report or Export when sharing weekly or monthly summaries with stakeholders