Overview
Overview
The Overview module is the primary screen for monitoring daily tracked work hours across your team or for an individual user. It provides visibility into daily target completion, 24-hour activity timelines, focus breakdowns, manual time logging, and captured session screenshots.
Tracker → Overview
Overview Page
Team View
Daily Summary Cards
The top of the Overview page shows a horizontal strip of clickable daily cards for the selected month, allowing you to monitor daily completion and select any day to inspect its logs:
| Element | Description |
|---|---|
| Date Header | Day and date for the card (e.g. Wed 11 Nov) |
| Activities Badge | Count badge showing activities recorded for that day |
| Logged vs. Expected Time | Total hours logged against expected team hours (e.g. 3h 55m of 252h 00m) |
| Progress Bar & Remaining Time | Completion percentage (2% done) and remaining hours (248h 05m left) |
Completion Color Legend:
- Green —
Complete (100%) - Blue —
75% - 99% - Purple —
50% - 74% - Yellow —
25% - 49% - Red —
< 25%
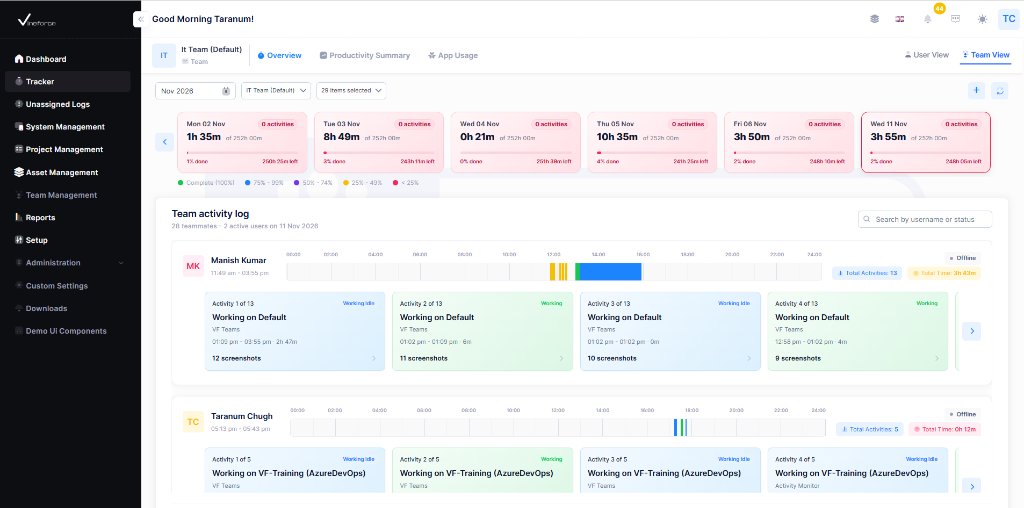
Filters for Month (Nov 2026), Team (It Team (Default)), and Users (28 items selected) are available above the cards, along with User View / Team View toggles, an Add (+) button, and a Refresh button.
Team Activity Log
Below the daily cards, the Team activity log section displays active users for the selected date (e.g. 28 teammates · 2 active users on 11 Nov 2026). A Search by username or status bar is available on the right to filter users dynamically.
User Timeline Row
Each user entry displays:
| Column / Element | Description |
|---|---|
| User Info | User avatar (or initials), name, and active time window (e.g. 11:49 am - 03:55 pm) |
| 24-Hour Timeline Bar | Color-coded timeline (00:00 to 24:00) showing active intervals and gaps across the day |
| Status & Summary Badges | Current status badge (e.g. Offline), Total Activities count, and Total Time logged |
Activity Cards
Below each user's timeline bar, a scrollable carousel of activity cards breaks down individual tracked sessions:
| Field | Description |
|---|---|
| Activity Index | Sequence position for the day (e.g. Activity 1 of 13) |
| Status Badge | Activity state for the session (e.g. Working, Working Idle) |
| Project / Task | Task or project being tracked (e.g. Working on Default, Working on VF-Training (AzureDevOps)) |
| Application / Source | Application or tracker source recorded (e.g. VF Teams, Activity Monitor) |
| Time & Duration | Start time, end time, and duration (e.g. 01:08 pm - 03:55 pm · 2h 47m) |
| Screenshots Link | Number of captured screenshots (e.g. 12 screenshots >), clickable to open the full screenshot viewer |
User View
Click User View in the top-right header to inspect a single employee's daily progress, 24-hour timeline, inline screenshots, and focus breakdown.
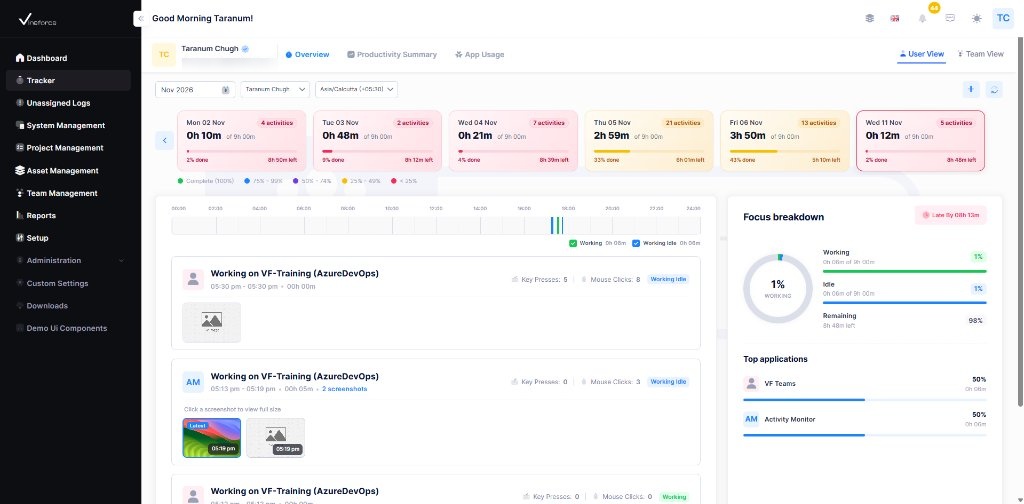
User View Controls & Layout
- Filters — Select the Month (
Nov 2026), User (Taranum Chugh), and Time Zone (Asia/Calcutta (+05:30)). - 24-Hour Timeline Bar — Includes Working and Working Idle checkboxes underneath to filter the timeline and activity list by status.
- Session Cards with Inline Thumbnails — Each session card displays Key Presses, Mouse Clicks, status badge, and clickable screenshot thumbnails with timestamps (click any thumbnail to view full size).
- Focus Breakdown Panel (Right Side) — Displays:
- Late / attendance status badge (e.g.
Late By 08h 13m) - Working percentage donut chart
- Progress bars for Working, Idle, and Remaining hours
- Top applications list showing percentage and time spent per app (e.g.
VF Teams,Activity Monitor)
- Late / attendance status badge (e.g.
Add Manual Tracker Time
Authorized users can log manual tracker time entries directly from the Overview page.
- Navigate to
Tracker → Overview. - Click the + button in the top-right toolbar.
- Fill in the required fields and click Save.
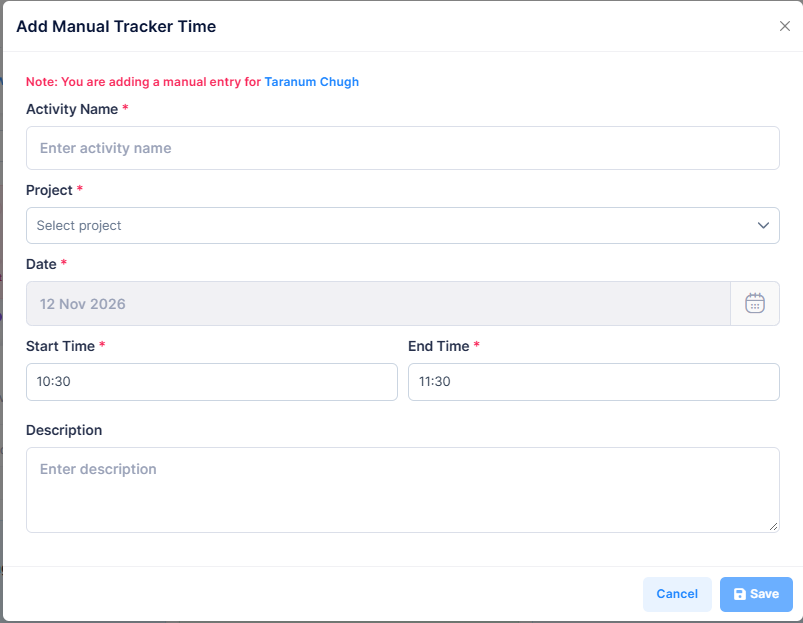
| Field | Required | Description |
|---|---|---|
| Activity Name | Yes | Name or title of the activity |
| Project | Yes | Project associated with the manual time entry |
| Date | Yes | Date for the manual entry (e.g. 12 Nov 2026) |
| Start Time | Yes | Start time of the activity (e.g. 10:30) |
| End Time | Yes | End time of the activity (e.g. 11:30) |
| Description | No | Additional notes or details about the work performed |
A notice banner at the top of the modal confirms which user the manual entry is being added for (e.g. Note: You are adding a manual entry for Taranum Chugh).
Activity Details & Screenshots
Clicking any activity card, screenshot count link (e.g. 12 screenshots >), or inline screenshot thumbnail opens the Details of [Date] - [Activity] modal to inspect captured screenshots and system telemetry.
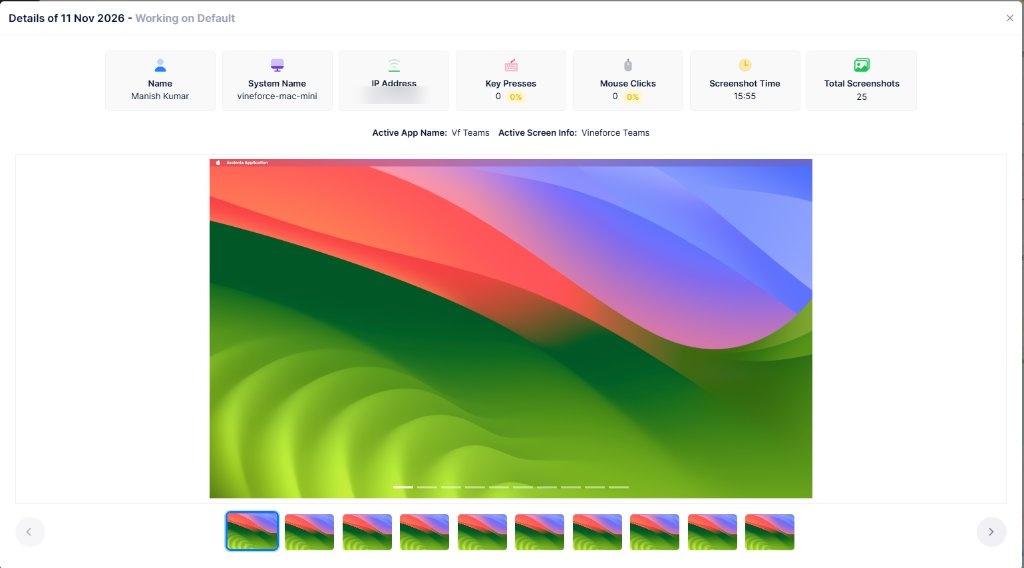
Telemetry Summary Cards
The top of the modal displays seven summary cards for the selected screenshot:
| Card | Description |
|---|---|
| Name | Employee name (e.g. Manish Kumar) |
| System Name | Hostname of the machine where the activity was captured (e.g. vineforce-mac-mini) |
| IP Address | IP address of the user's machine |
| Key Presses | Total key presses and activity percentage for the interval |
| Mouse Clicks | Total mouse clicks and activity percentage for the interval |
| Screenshot Time | Exact timestamp when the screenshot was captured (e.g. 15:55) |
| Total Screenshots | Total number of screenshots captured in the session (e.g. 25) |
Below the cards, Active App Name and Active Screen Info show which application and window were in focus when the screenshot was taken. Use the thumbnail strip and < / > arrows at the bottom to step through all screenshots in the session.
Best Practices
- Review the daily summary cards to spot days with low logged-hour completion early
- Use Search by username or status in Team View to quickly locate specific team members
- Switch to User View to inspect an individual employee's Focus breakdown and Top applications
- Click through activity screenshots to verify Active App Name, Key Presses, and Mouse Clicks alongside captured visuals
- Use Add Manual Tracker Time only for verified offline work or missed tracking intervals