App Usage
Overview
The App Usage module provides granular visibility into how much time employees spend on individual desktop applications and websites (URLs). It highlights top and bottom usage through summary cards, displays day-by-day activity with period-over-period trends, supports User View and Team View, and allows exporting usage data to Excel.
Tracker → App Usage
App Usage Page
Team View
Summary Cards
The top of the App Usage page shows four color-coded cards summarizing application and URL activity for the selected filters and date range:
| Card | Description |
|---|---|
| Most Used App | Application with the highest recorded usage time, comparison total (e.g. 03h 42m / 04h 08m), and percentage bar (88%) |
| Least Used App | Application with the lowest recorded usage time, comparison total, and percentage bar |
| Most Used URL | Website/URL with the highest recorded usage time, comparison total, and percentage bar (shows No data if none recorded) |
| Least Used URL | Website/URL with the lowest recorded usage time, comparison total, and percentage bar (shows No data if none recorded) |
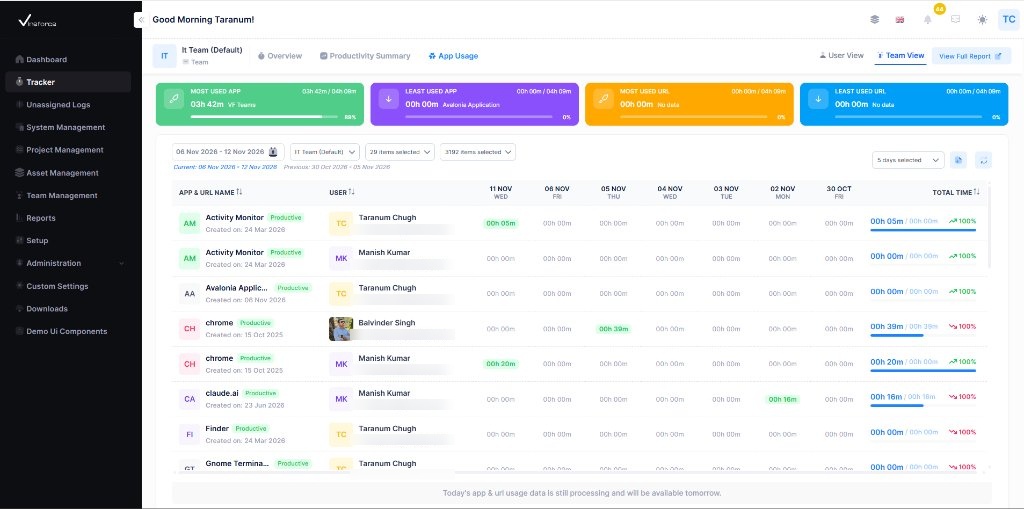
Filters for Date Range (showing Current and Previous periods), Team, Users, Apps & URLs, and Days Selector (5 days selected) are available above the table, along with User View / Team View, View Full Report, Export, and Refresh controls.
Clicking the Export icon in the toolbar downloads the filtered usage table directly as an Excel file (UserAppAndUrlReport.xlsx).
App & URL Usage List
Below the filters, each row represents an application or URL used by a specific employee across the selected days:
| Column | Description |
|---|---|
| App & URL Name | App/URL icon badge, name (e.g. Activity Monitor, chrome, claude.ai), productivity label (e.g. Productive), and Created on date (sortable) |
| User | User avatar (or initials) and full name (sortable) |
| Per-Date Columns | Daily columns (e.g. 11 NOV WED, 06 NOV FRI) showing recorded duration, highlighted in green when active |
| Total Time | Current period duration versus previous period (e.g. 00h 05m / 00h 00m), progress bar, and percentage trend arrow (sortable) |
Today's app & URL usage data is still processing and will be available tomorrow.
User View
Click User View in the top-right header to focus the App Usage tab on a single employee.
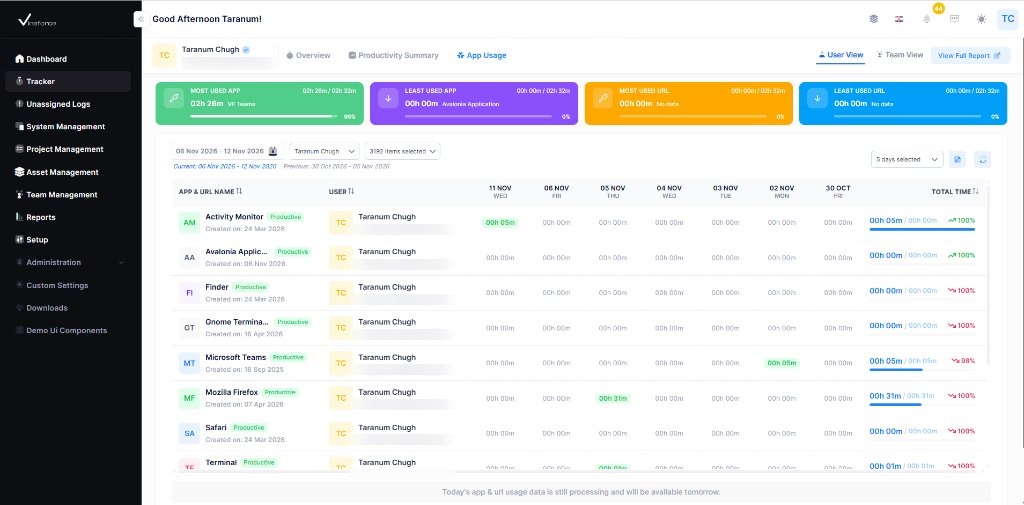
- Header — Displays the selected user's avatar and name (e.g.
Taranum Chugh). - Filters — Select the Date Range (
06 Nov 2026 - 12 Nov 2026), User (Taranum Chugh), and Apps & URLs (3192 items selected), plus Days Selector, Export, and Refresh controls. - Summary Cards & Table — Displays the user's Most/Least Used App & URL cards and their individual app/URL usage rows.
App & URL Usage Detail
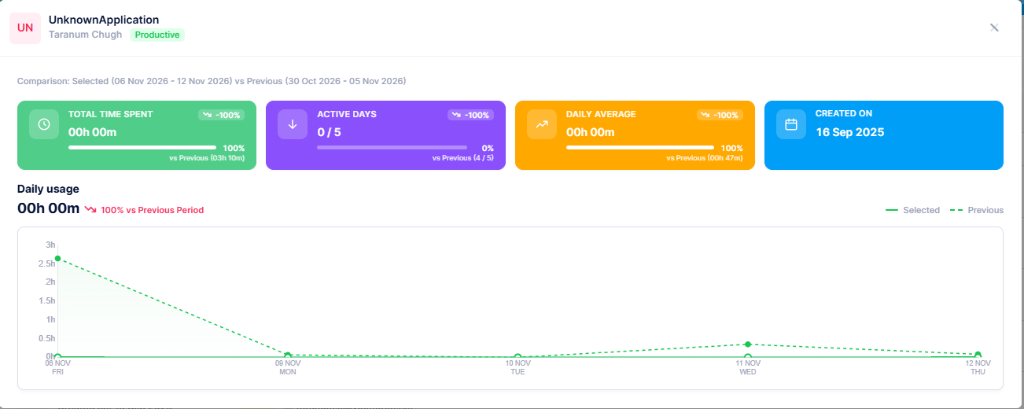
Clicking any row in the App & URL Usage table opens a detail modal for that specific application or URL and user, comparing the selected period against the previous period (e.g. Comparison: Selected (06 Nov 2026 - 12 Nov 2026) vs Previous (30 Oct 2026 - 05 Nov 2026)).
Summary Cards
The top of the modal displays four summary cards:
| Card | Description |
|---|---|
| Total Time Spent | Total duration recorded on that app/URL during the selected period, percentage change, and comparison vs Previous |
| Active Days | Number of days the app/URL was used out of the selected days (e.g. 0 / 5), percentage change, and comparison vs Previous |
| Daily Average | Average daily usage time for that app/URL, percentage change, and comparison vs Previous |
| Created On | Date the application or URL was first recorded in the system (e.g. 16 Sep 2025) |
Daily Usage Chart
Below the cards, the Daily usage line chart compares Selected (solid green line) against Previous (dashed green line) day by day across the reporting window, along with the total duration and percentage change vs. the previous period.
Best Practices
- Filter by specific Users or Apps & URLs to investigate unexpected software or website usage
- Click any row in the table to inspect its Daily usage trend and Active Days comparison
- Use Export to download
UserAppAndUrlReport.xlsxfor offline analysis or sharing - Click View Full Report to open User App Usage Reports for broader cross-date reporting
- Check productivity classifications (
Productive, etc.) in Setup → Apps & URLs so summary metrics stay accurate