User Reports
Overview
The User Reports section provides a day-by-day breakdown of time logged by each user, split into Productive and Non-Productive hours. It enables managers and administrators to monitor individual user activity over time, compare daily performance, and spot productivity trends — all within a single filterable table.
Login → Reports → User Reports
Accessing User Reports
- Navigate to Reports from the left-hand navigation menu.
- On the Reports dashboard, click View Report under User Reports.
User Reports View
The report displays a table where each row represents a user and each column represents a date, showing that user's Productive and Non-Productive time logged on that date.
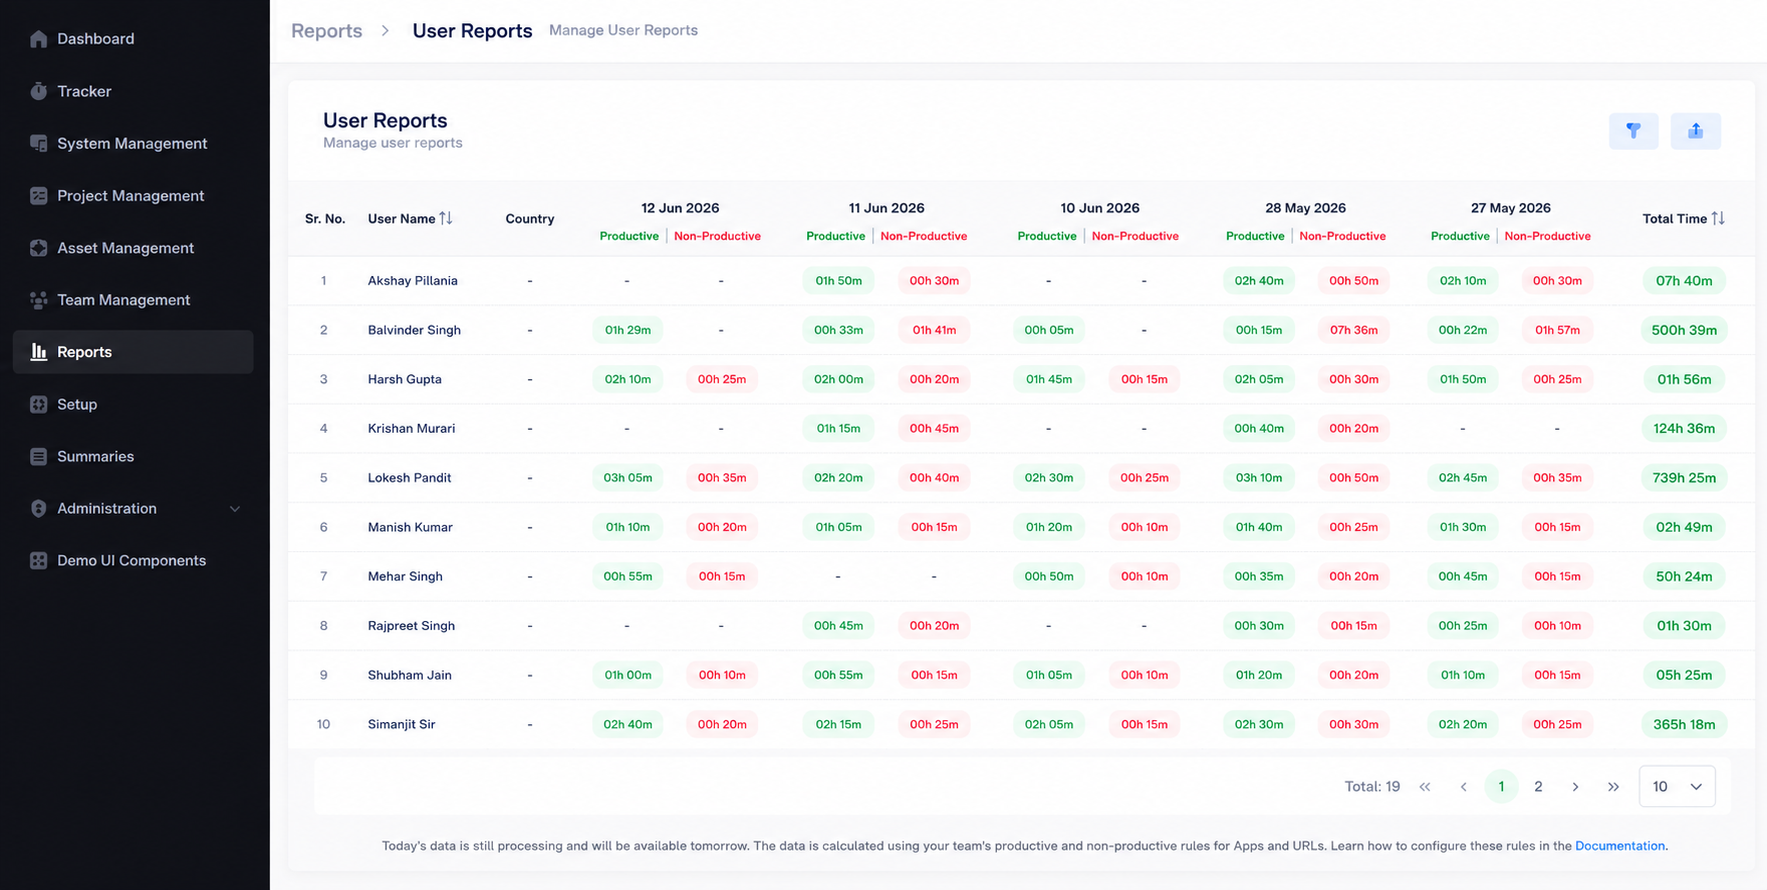
Table Columns
| Column | Description |
|---|---|
| Sr. No. | Row number for the user. |
| User Name | Name of the team member. Clickable to view more detail. |
| Country | Country associated with the user. Sortable. |
| Per-Date Columns | One column per date in the selected range, split into Productive (green) and Non-Productive (red) time logged that day. Shows - if no activity was recorded. |
| Total Time | Aggregate time logged by the user across all dates in the range. Highlighted and sortable. |
A - in any date column means the user had no recorded activity for that day.
Filters
The report can be refined using filters at the top of the page (not shown in the captured view), typically including:
| Filter | Description |
|---|---|
| Select Date Range | Choose a custom start and end date to limit the report to a specific period. |
| Select Users | Multi-select dropdown to include specific team members. |
| Select Country | Filter users by their associated country. |
After configuring filters:
- Click Apply to refresh the report with the selected criteria.
- Click Reset to clear all filters and return to the default view.
Available date columns update dynamically based on the selected date range. Only dates within the range will appear as columns.
Sorting and Pagination
- Click the sort icon (↑↓) next to User Name, Country, or Total Time to reorder the table.
- Use the pagination controls at the bottom of the table to move between pages of results.
- Use the rows-per-page dropdown (e.g. 10) to control how many users are displayed per page.
- The Total count at the bottom-left shows the overall number of users in the report.
Data Processing Note
Reports are calculated based on your team's configured productive and non-productive rules for apps and URLs.
Today's data is still processing and will be available the next day. Rules for classifying apps and URLs as productive or non-productive can be configured in the documentation.
Exporting Reports
Report data can be exported to Excel for external analysis, management reviews, or record keeping.
- Apply the required filters and click Apply.
- Review the generated report data.
- Click the Export to Excel button at the top-right of the page.
- The file will download to your device.
Exported reports can be used for:
- Performance evaluations
- Workforce analysis
- Productivity monitoring
- Management reviews
- Audit reporting
Permissions
Access to User Reports is controlled through user roles and permissions.
Typically available to:
- Administrators
- Managers
- Team Leads
- Authorized Reporting Users
Users will only be able to view data they have permission to access. Available users and countries in the filter dropdowns are also restricted by role.
Related Documentation
- Reports Overview
- Project Reports
- Shift Reports
- User App Usage Reports
- User Attentiveness Reports