User App Usage Reports
Overview
The User App Usage Reports section provides a detailed breakdown of time spent by each user on individual applications and websites, day by day. It enables managers and administrators to monitor software and web usage at a granular level, identify which apps or URLs consume the most time, and compare usage across users — all within a single filterable table.
Login → Reports → User App Usage Reports
Accessing User App Usage Reports
- Navigate to Reports from the left-hand navigation menu.
- On the Reports dashboard, click View Report under User App Usage Reports.
User App Usage Reports View
The report displays a table where each row represents a unique App/URL and User combination, and each column represents a date, showing the time that user spent on that app or URL on that day.
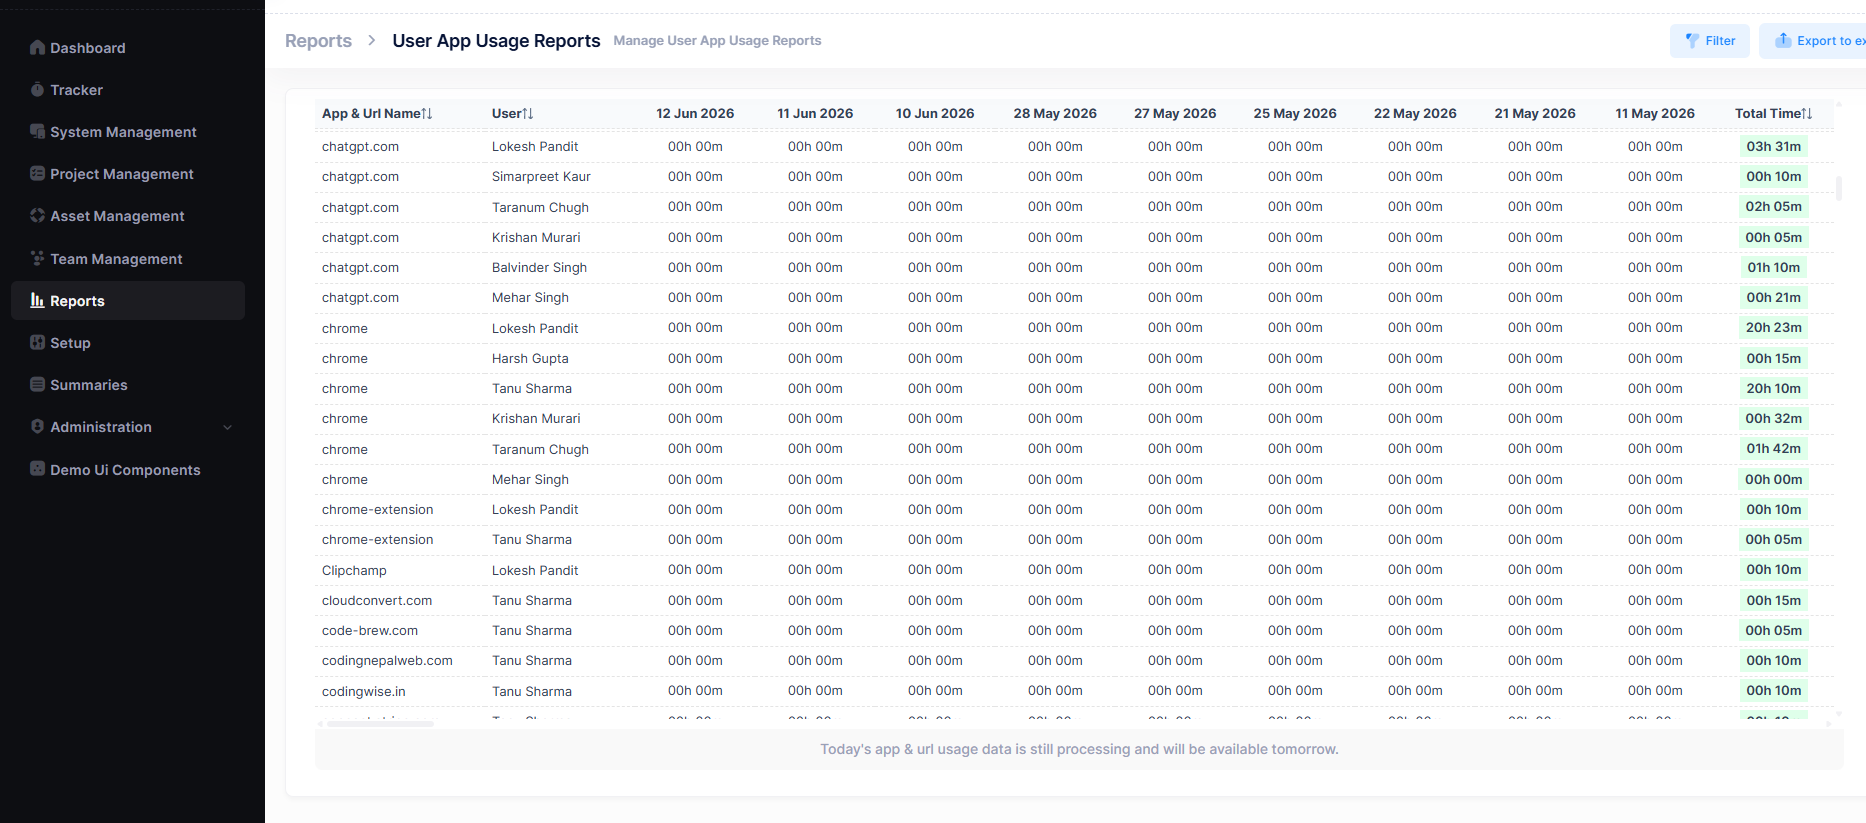
Table Columns
| Column | Description |
|---|---|
| App & URL Name | Name of the application or website (e.g. chrome, chatgpt.com, chrome-extension). Sortable. |
| User | Name of the team member who used the app or URL. Sortable. |
| Per-Date Columns | One column per date in the selected range, showing the time that user spent on that app or URL on that day (e.g. 00h 00m). |
| Total Time | Aggregate time the user spent on that app or URL across all dates in the range. Highlighted in green and sortable. |
Each app or URL appears as a separate row per user, so the same application (e.g. chrome) may appear multiple times — once for each user who used it.
Filters
Use the Filter button at the top-right of the page to refine the data displayed. Typical filters include:
| Filter | Description |
|---|---|
| Select Date Range | Choose a custom start and end date to limit the report to a specific period. |
| Select Users | Multi-select dropdown to include specific team members. |
| Select App/URL | Filter the report to specific applications or websites. |
After configuring filters:
- Click Apply to refresh the report with the selected criteria.
- Click Reset to clear all filters and return to the default view.
Available date columns update dynamically based on the selected date range. Only dates within the range will appear as columns.
Sorting and Scrolling
- Click the sort icon (↑↓) next to App & URL Name, User, or Total Time to reorder the table.
- Use the horizontal scrollbar below the table to view additional date columns.
- Use the vertical scrollbar to view additional app/URL rows.
Data Processing Note
Reports are calculated based on actual time spent per app or URL as tracked by the system.
Today's app & URL usage data is still processing and will be available the next day.
Exporting Reports
Report data can be exported to Excel for external analysis, management reviews, or record keeping.
- Apply the required filters and click Apply.
- Review the generated report data.
- Click the Export to Excel button at the top-right of the page.
- The file will download to your device.
Exported reports can be used for:
- Software utilization analysis
- Productivity reviews
- Workforce management
- Compliance reporting
- Operational reporting
Permissions
Access to User App Usage Reports is controlled through user roles and permissions.
Typically available to:
- Administrators
- Managers
- Team Leads
- Authorized Reporting Users
Users will only be able to view data they have permission to access. Available users and apps/URLs in the filter dropdowns are also restricted by role.
Related Documentation
- Reports Overview
- Project Reports
- User Reports
- Shift Reports
- User Attentiveness Reports