Project Reports
Overview
The Project Reports section provides a detailed breakdown of time spent by each user across all assigned projects. It enables managers and administrators to monitor resource utilization, compare project-level contributions, and identify productivity trends — all within a single filterable table.
Login → Reports → Project Reports
Accessing Project Reports
- Navigate to Reports from the left-hand navigation menu.
- On the Reports dashboard, click View Report under Project Reports.
Project Reports View
The report displays a table where each row represents a user and each column represents a project, showing the time that user has logged against that project.
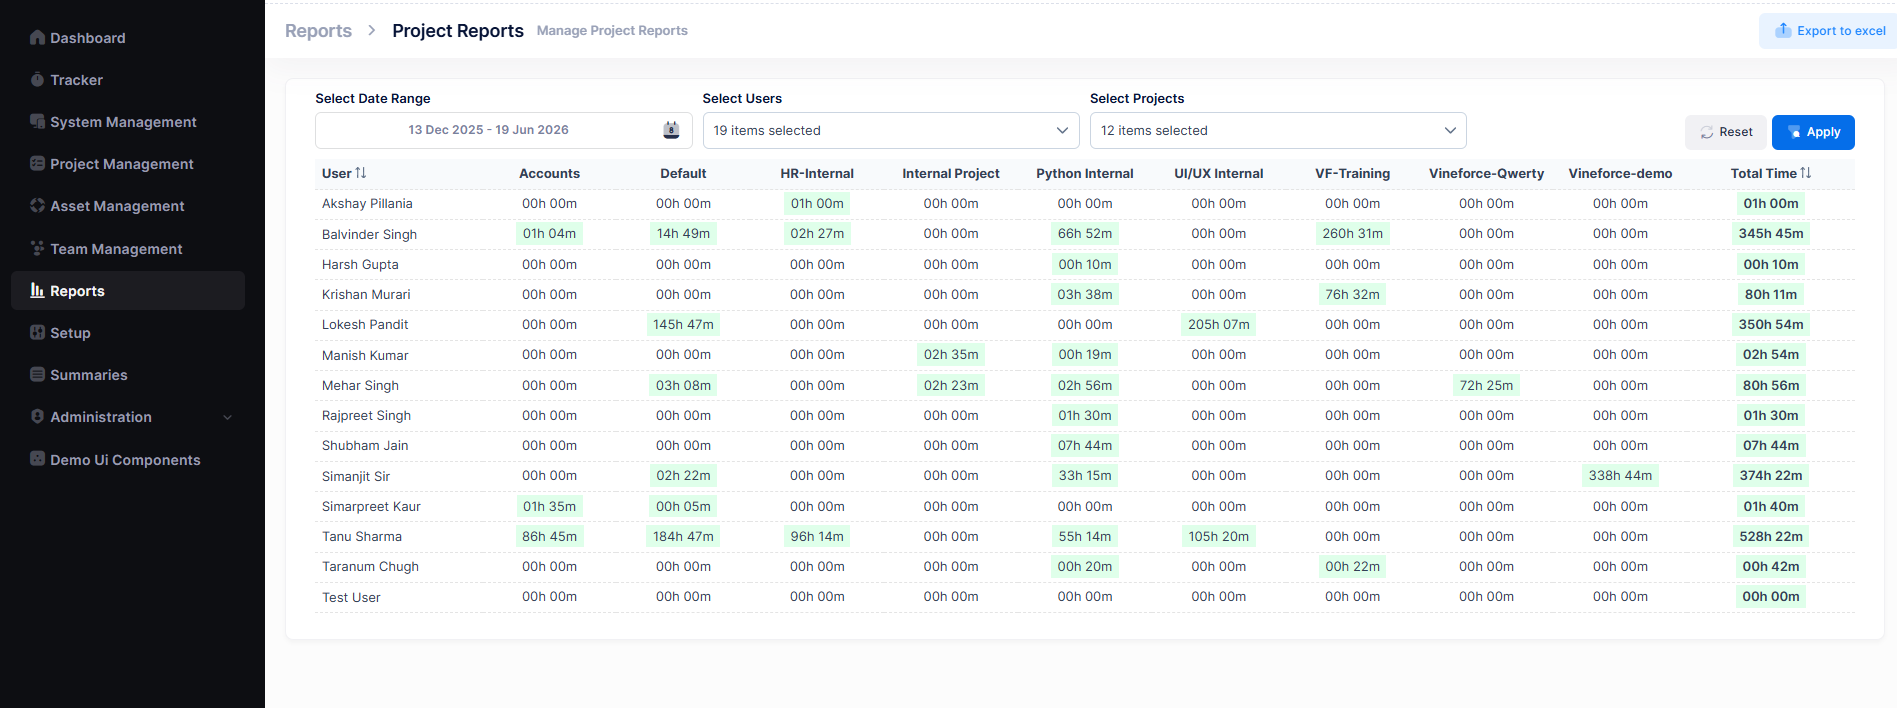
Table Columns
| Column | Description |
|---|---|
| User | Name of the team member. Clickable to sort alphabetically. |
| Per-Project Columns | One column per selected project showing hours logged (e.g. 01h 00m, 145h 47m). Non-zero values are highlighted in green for quick identification. |
| Total Time | Aggregate time logged by the user across all selected projects. Sortable. |
Filters
Three filters at the top of the report allow you to refine the data displayed:
| Filter | Description |
|---|---|
| Select Date Range | Choose a custom start and end date to limit the report to a specific period (e.g. 13 Dec 2025 – 19 Jun 2026). |
| Select Users | Multi-select dropdown to include specific team members. Displays the count of selected users (e.g. 19 items selected). |
| Select Projects | Multi-select dropdown to include specific projects. Displays the count of selected projects (e.g. 12 items selected). |
After configuring filters:
- Click Apply to refresh the report with the selected criteria.
- Click Reset to clear all filters and return to the default view.
Available filters and visible project columns update dynamically based on your selections. Only projects with activity in the selected date range will appear as columns.
Exporting Reports
Report data can be exported to Excel for external analysis, management reviews, or record keeping.
- Apply the required filters and click Apply.
- Review the generated report data.
- Click the Export to Excel button at the top-right of the page.
- The file will download to your device.
Exported reports can be used for:
- Management reviews and project audits
- Performance and resource planning
- Client reporting
- Historical trend analysis
Permissions
Access to Project Reports is controlled through user roles and permissions.
Typically available to:
- Administrators
- Project Managers
- Team Leads
- Authorized Reporting Users
Users will only be able to view data they have permission to access. Available projects and users in the filter dropdowns are also restricted by role.
Related Documentation
- Reports Overview
- User Reports
- Shift Reports
- User App Usage Reports
- User Attentiveness Reports